About the Gregory-Portland Stations
Introduction to Air Quality Monitoring
Air monitors can detect and measure even small amounts of chemicals and particles in the air. The chemicals and particles can come from many places such as gasoline-powered lawn mowers and leaf blowers, barbeque grills, our cars, small businesses, and large industrial plants. If the monitors detect increased levels of a certain air emission, appropriate personnel can be alerted to determine
Objectives of the Air Monitoring Stations
Measuring the Air Quality to Keep the Community Informed
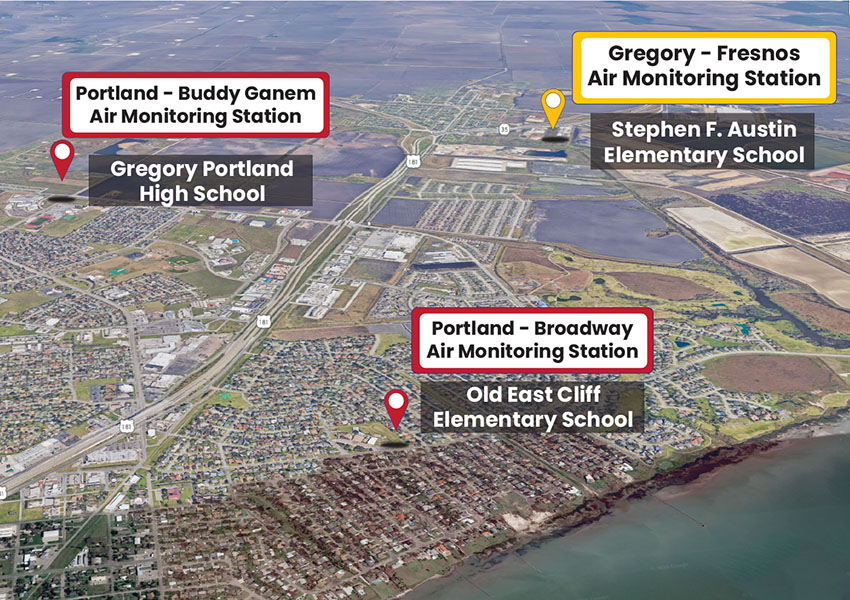
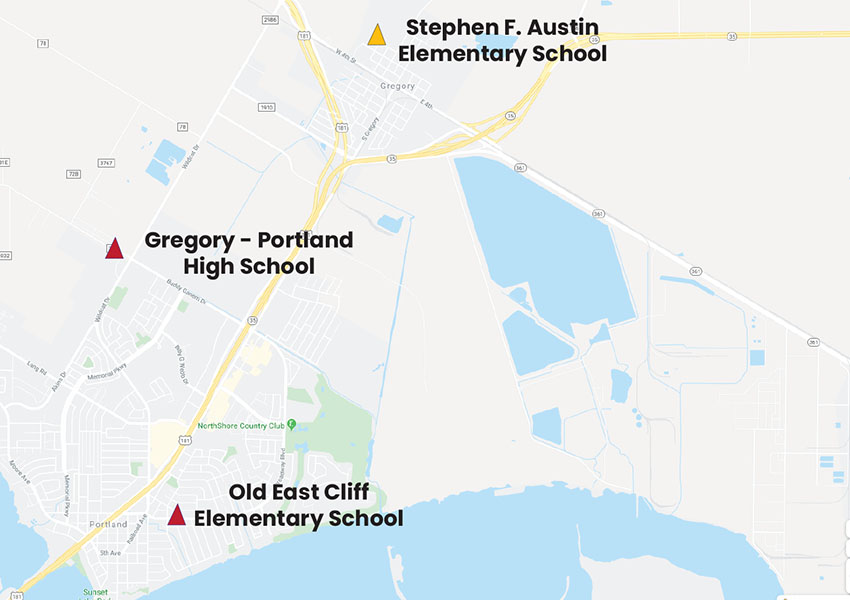
The objective of the Gregory-Portland air monitoring stations is to measure the ambient (outdoor) air quality 24 hours a day, 7 days a week, and keep the community informed of the air quality status as development continues to occur over time in the area. This will be accomplished by continuously monitoring the air in the Gregory-Portland community at the three air monitoring stations shown in Figure 1

Design of the Air Monitoring Stations
Gregory-Portland air monitors are located on school campuses in the Gregory-Portland ISD and also located proximate to urban and industrial activity. The Environmental Protection Agency (EPA) has identified emissions associated with some of these activities and chemicals produced in the air a concern because they can cause health effects. Air monitoring stations have been designed to include instruments that will measure the concentration of these chemicals of concern (see Table 1) in the ambient air
Unique Design Features of the Gregory - Fresnos Station
Each of the stations is operated by a private company (a contractor) experienced in making these measurements (see table below).
| Air Monitoring Station | Contractor |
|---|---|
| Gregory - Fresnos | The University of Texas & Orsat |
| Portland - Buddy Ganem | Orsat |
| Portland - Broadway | Orsat |
In the case of the Gregory - Fresnos station, the station sponsor, Cheniere Energy, selected the team from The University of Texas at Austin that conducts air quality studies in Texas and nationwide to independently manage the station operations and oversee (audit) the contractor periodically to ensure all EPA & TCEQ quality control procedures are being employed to further assure the community of this level
![]()
| Air Monitoring Stations | Volatile Organic Compounds (VOCs) | Nitrogen Oxides (NOx) | Sulfur Dioxide (SO2) | Particulate Matter (PM) < 2.5 micron | Meteorology |
|---|---|---|---|---|---|
| Gregory - Fresnos | Measured | Measured | Measured | Measured | Measured |
| Portland - Buddy Ganem | Measured | Not Measured | Not Measured | Measured | Measured |
| Portland - Broadway | Measured | Not Measured | Not Measured | Measured | Measured |
- All values reported will be hourly averages except for canister data.
- VOCs will be posted within 60 days of the end of the month.
- NOx, SO2, PM 2.5, WS, WD, T & BP will be posted on the Wednesday following the week ending (Friday).
- Summa canister analyses will be posted within 24 hours of receipt by UT Austin.
- Reporting days that occur during Holidays will be posted on the next business day.
- Start of measurements: Gregory - Fresnos on October 1, 2019, Portland - Buddy Ganem and Portland - Broadway on January 1, 2020.
| Instruments | Parameter, units of measure | Time Resolution |
|---|---|---|
| Speciated Volatile Organic Compound (VOC) Measurement via automated gas chromatography: Perkin Elmer 100TD Ozone Precursor Auto GC | 46 hydrocarbons from 2-carbon to 10-carbon, parts per billion-Carbon (ppbC) see Table 2b. | 1-hour (average) |
| Met One | Wind speed miles per hour/ wind direction, degrees / ambient temperature, degrees Fahrenheit (F) | 5-minute & 1-hour (averages) |
| NOx Measurement: Teledyne Model T200 | Nitric oxide (NO), nitrogen dioxide (NO2), and the sum of NO and NO2 (NOx) parts per billion (ppb) | 5-minute & 1-hour (averages) |
| Sulfur dioxide (SO2) Measurement: Teledyne Model T100 | SO2 ppb | 5-minute & 1-hour (averages) |
| Fine Particulate Matter Measurement: Met One Beta Attenuation Monitoring System (BAMS) Model 1020 | PM 2.5 micrograms per cubic meter (µg/m3) | 1-hour (average) |
| Ethylene Oxide (EtO) Measurement: Summa Canister | EO ppbC | 24-hr & 1-hour (averages) |
| Instruments | Method of Operation |
|---|---|
| Speciated Volatile Organic Compound (VOC) Measurement via automated gas chromatography: Perkin Elmer 100TD Ozone Precursor Auto GC | Measures 46 hydrocarbon species, C2 to C10 each hour ~ 22 hrs / day, QA ~ 2hrs / day. The air sample is chilled, and the hydrocarbons liquefy. The sample is then heated, and individual species evaporate at each’s boiling point temperature. The vapor moves along a capillary tube that ends at a pilot light that flames with an intensity directly proportional to the amount of vapor in a process called flame ionization. The intensity is recorded as a curve (chromatogram) rising from zero to a peak and then dropping, the area under which is integrated to estimate the concentration of that species in that sample. |
| NOx Measurement (Teledyne Model T200) | This gas analyzer draws in a sample of air, then reacts the sample with ozone. One ensuing reaction is NO + O3 → NO2 + ν, and the intensity of the emitted ν photons at their specific wavelength gives us the NO concentration. Seconds later, another air sample is drawn through a heated catalyst that reduces NO2 to NO, and the second air sample is reacted with ozone. The result of the second sample analysis provides the estimate for NOx. The two analyses are combined to give the NO concentration from the first sample, and the NO2 concentration from the difference of the second sample minus the first sample NO concentration. This method is called “chemiluminescence”. One drawback to this method is that some other oxides of nitrogen (e.g., nitric acid, peroxy acetyl nitrate) may also be reduced to NO and thus included in the NO2 and NOx estimations. |
| SO2 Measurement (Teledyne Model T100) | This gas analyzer draws in a sample of air, then radiates the sample with UV light at a specific wavelength that causes SO2 rise to a higher energy state: SO2 + ν1 → SO2*. When the UV light is turned off, SO2* quickly drops to its normal level and in the reaction SO2* → SO2 + ν2. The intensity of the photons from this second reaction provides the estimate for SO2 concentration. This method is called “pulsed fluorescence”. |
| Fine Particulate Matter Measurement (Met One BAMS Model 1020) | BAMS = Beta attenuation monitoring system The method determines how much mass has accumulated on a clean filter tape each hour. First, a carbon-14 source emits a constant stream of high-energy electrons (“beta rays”) through a spot of clean filter tape. A count of detectable electrons is made by a detector. The tape is advanced to be exposed to ambient air drawn through the filter tape, and fine particulate matter accumulates on the tape. The air being drawn into the analyzer has passed through a “cyclone” separator, in which larger (heavier) particles have been removed and only particles generally sized at 2.5 microns and smaller are in the air stream. After the prescribed exposure duration, the tape moves back to the beta source and detector, and a new measurement is made. The difference in detected electrons is proportional to the mass on the filter tape, which, when combined with the volume of air flow during the ambient exposure period provides an estimate of the fine particulate matter. |
| Ethylene Oxide (EO) Measurement: Summa Canister | Two methods of sampling for EO are used. In each case, a stainless steel glass-lined evacuated canister attached to a control system and a sampling line to outside air. The first method is for every sixth-day, on a schedule provided by U.S. EPA for similarly timed data collection across the country, a valve opens at midnight and ambient air is sucked into the canister at a constant flow rate over 24 hours, at which point the valve closes. The second method uses an associated ethylene oxide analyzer that triggers a canister to begin collecting air for 1 hour. For both methods, the canister is detached from the control system and sent to a laboratory. At the lab, the canister sample is evaluated with gas chromatography to determine the ethylene oxide concentration. |
|
Ethane Ethylene Propane Propylene Isobutane n-Butane Acetylene t-2-Butene 1-Butene c-2-Butene Cyclopentane Isopentane n-Pentane |
1, 3-Butadiene t-2-Pentene 1-Pentene c-2-Pentene 2,2-Dimethylbutane Isoprene n-Hexane Methylcyclopentane 2,4-Dimethylpentane Benzene Cyclohexane 2-Methylhexane 2,3-Dimethylpentane |
3-Methylhexane 2,2,4-Trimethylpentane n-Heptane Methylcyclohexane 2,3,4-Trimethylpentane Toluene 2-Methylheptane 3-Methylheptane n-Octane Ethyl Benzene p-Xylene & m-Xylene Styrene o-Xylene |
n-Nonane Isopropyl Benzene-Cumene n-Propylbenzene 1,3,5-Trimethylbenzene 1,2,4-Trimethylbenzene n-Decane 1,2,3-Trimethylbenzene Ethylene Oxide |
Meteorological Measurement Systems
The standard operating procedure (SOP) for operating the meteorological system is TCEQ SOP FOSTAT-029. Meteorological sampling procedures used in this monitoring program are consistent with EPA Quality Assurance Handbook for Air Pollution Measurement Systems, Volume IV. The instrumentation used for meteorological monitoring will meet or exceed all prevention of significant deterioration performance criteria.
The parameters measured and their ranges are:
| Parameter | Range | Time Resolution |
|---|---|---|
| Wind Speed | 0 to 100 miles per hour | 1-hour (average) |
| Wind Direction | 0 to 360 degrees (°) | 1-hour (average) |
| Temperature | -22 to +120° Fahrenheit | 1-hour (average) |
Locating the Air Monitoring Stations
So that the measurements made and data obtained are representative of the air Gregory-Portland residents breathe and are exposed to daily, the air monitoring stations have been located in the same areas residents live and spend their time. They have been sited (see Figure 1) to ensure that the air sampling will not be compromised by obstructions or nearby sources that would or could render the air quality measurements as non-representative of the local air quality.
Additional Information
Additional information on the pollutants being measured, the federal standards that govern concentrations, emission sources, and the potential health effects can be found at the links below: